Cruise Port Traffic
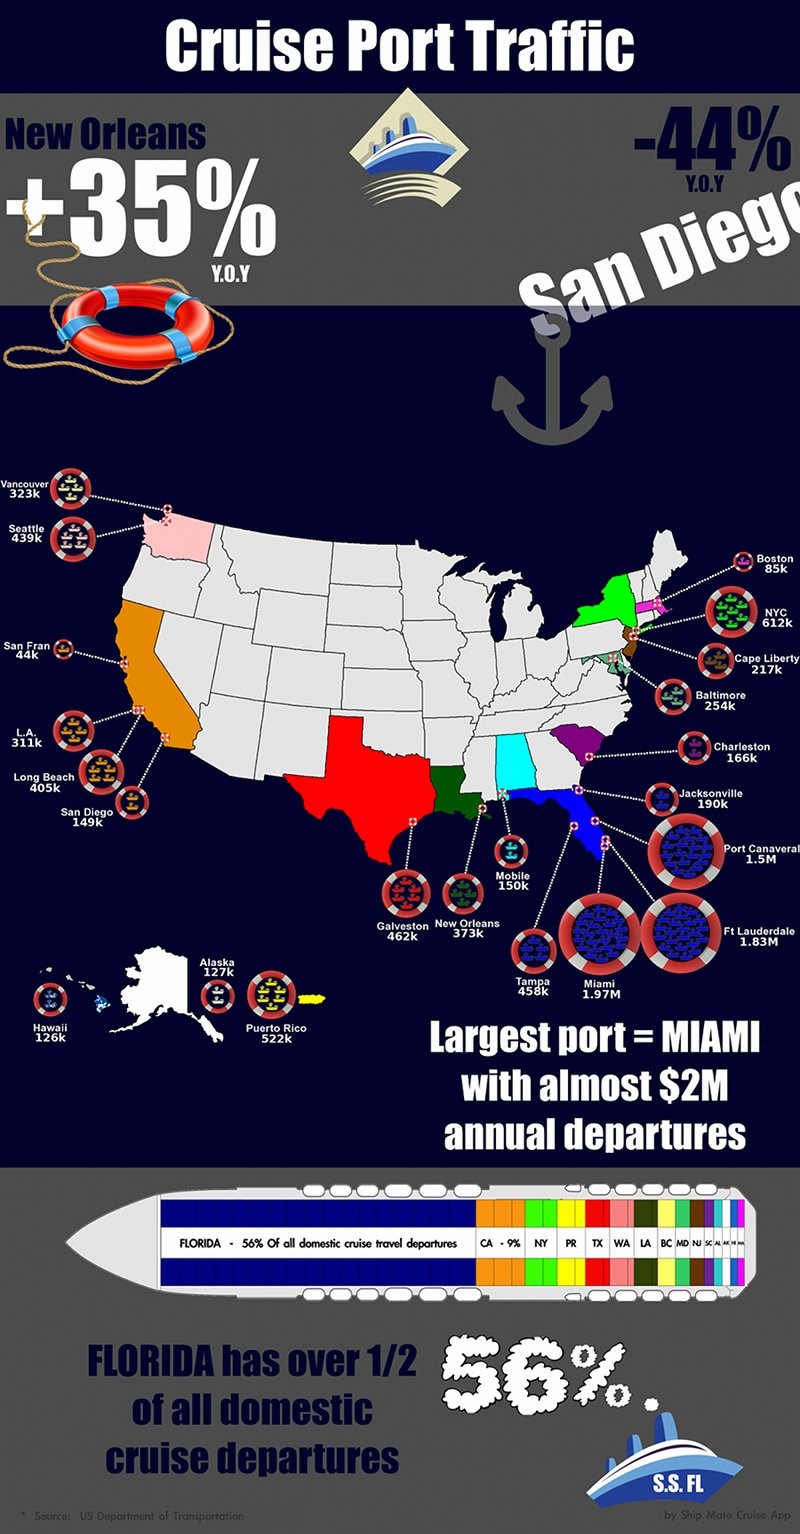
Every year the Department of Transportation publishes a report of the previous year’s cruise port traffic. We’ve taken the 1,400 page document (grossly exaggerated) and endless spreadsheets and consolidated the most important statistics into this fun infographic.
Click to enlarge.
Feel free to share this infographic using the HTML below:
[textbox rows=”2″]<a href=”http://shipmateblog.com/
Cruise Port Traffic Highlights
- 71.8 million passenger nights booked on N American cruises
- Average cruise ship size: 2,301 passengers
- Average utilization (booked capacity): 103%
- At 110%, Disney Cruise Lines has the highest utilization rate
- Cruse port with most annual departures: Miami with 1.97 million passengers
- Location with the least annual cruises: San Francisco with 44k
- Total debarkation points in N America: 23
- Most port locations in one state: Florida with five then California with four
- Largest traffic increase: New Orleans with a 35% jump
- Biggest drop in annual cruise passengers: San Diego with a 44% decrease
- With 47.6% of the market, Carnival Cruises wins most N American departures
- Coming in last among the 19 cruise lines is Fred Olsen Cruise Line with 0.3%
For those that love the details, here’s the cruise port traffic detail:
| Port | 000’s | % |
| Miami | 1970 | 18.4% |
| Fort Lauderdale | 1,826 | 17.1% |
| Port Canaveral | 1,496 | 14.0% |
| New York | 612 | 5.7% |
| San Juan | 522 | 4.9% |
| Galveston | 462 | 4.3% |
| Tampa | 458 | 4.3% |
| Seattle | 439 | 4.1% |
| Long Beach | 405 | 3.8% |
| New Orleans | 373 | 3.5% |
| Vancouver (CN) | 323 | 3.0% |
| Los Angeles | 311 | 2.9% |
| Baltimore | 254 | 2.4% |
| Cape Liberty | 217 | 2.0% |
| Jacksonville | 190 | 1.8% |
| Charleston | 165 | 1.5% |
| Mobile | 150 | 1.4% |
| San Diego | 148 | 1.4% |
| Honolulu | 126 | 1.2% |
| Boston | 85 | 0.8% |
| Seward | 65 | 0.6% |
| Whittier | 62 | 0.6% |
| San Francisco | 44 | 0.4% |
| Total | 10,705 | 100% |
Some states have multiple ports – Here’s it broken down by state:
| State | % |
| Florida | 55.5% |
| California | 8.5% |
| New York | 5.7% |
| Puerto Rico | 4.9% |
| Texas | 4.3% |
| Washington | 4.1% |
| Louisiana | 3.5% |
| Canada | 3.0% |
| Maryland | 2.4% |
| New Jersey | 2.0% |
| South Carolina | 1.5% |
| Alabama | 1.4% |
| Alaska | 1.2% |
| Hawaii | 1.2% |
| Massachusetts | 0.8% |
And finally, if you’d like to see which lines own this cruise port traffic, check this out:
| Cruise Line | % |
| Carnival Cruise Line | 47.6% |
| Royal Caribbean International | 34.2% |
| Norwegian Cruise Line | 17.2% |
| Holland America Line | 12.2% |
| Princess Cruises | 9.7% |
| Celebrity Cruise Line | 8.3% |
| Disney Cruise Line | 6.2% |
| Silversea Cruises | 4.3% |
| Regent Seven Seas Cruises | 1.1% |
| SeaDream Yacht Club | 1.1% |
| Cunard Line | 1.0% |
| Oceania Cruises | 0.9% |
| Crystal Cruises | 0.8% |
| MSC Italian Cruises | 0.8% |
| Costa Cruise Line | 0.6% |
| Seabourn Cruise Line | 0.4% |
| Aida Cruises | 0.4% |
| Azamara Club Cruises | 0.4% |
| Fred Olsen Cruise Line | 0.3% |
All cruise port traffic is based on the latest report published by the Maritime Administration of the United States Department of Transportation. This data is based off the latest full year of data (2011).
Which cruise port do you think it destined for more future cruise port traffic? Are there any that you refuse to sail from?
